...
The following browsers are supported:
Browser | Notes | |
|---|---|---|
Google Chrome | Version 53 and later | |
Microsoft Edge | Windows 10, Version 38 and later | |
Microsoft Edge (Chromium) | Version 90 97 and later |
| Info |
|---|
Firefox is not supported. Although most features work, there are incompatibilities which prevent some critical functions from working including the saving of settings. |
...
| Note |
|---|
The radar uses SSL to secure the connection to the radar. The device uses a self-generated certificate which will normally generate a warning in the browser. You should consider the network interface as being safe and when prompted you should opt to continue. If you follow the default advice the browser will not allow you to load the interface. You can download and install a Navtech Radar root certificate on your PC. This will confirm the identity of the self-generated certificate and will prevent further warnings from the browser. See below for details on installing the certificate. |
To access the interface:
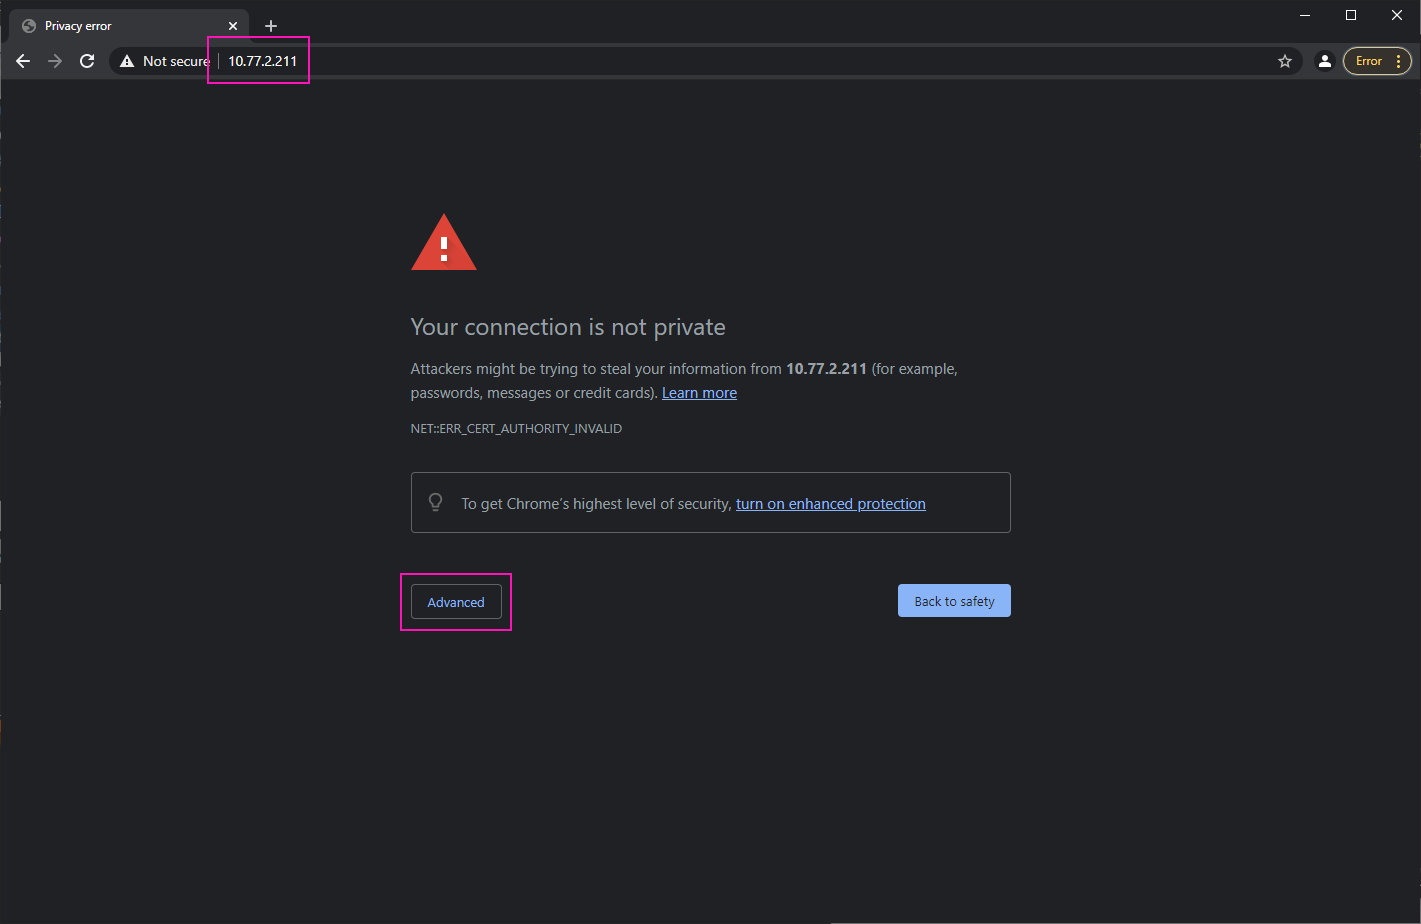
Open a supported browser and enter the IP address of the radar.
Dismiss the warning and continue. The process can vary between browsers, the example illustrated here is using Chrome.
Select the Advanced button:
...
Click on the displayed link:
...
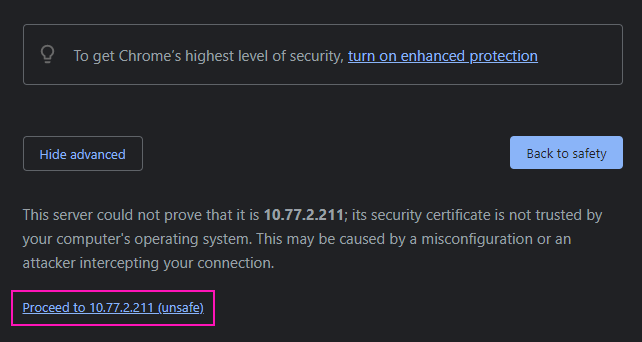
The radar’s default status page will now load
Status Page
| Status | ||||
|---|---|---|---|---|
|
| Status | ||||
|---|---|---|---|---|
|
The default status page is available to any user without logging into Vertex.
It displays basic static settings (i.e. Auto-Hostname, Radar serial number, IP address, etc.) plus dynamic graphs (arranged on two tabs in the lower portion of the page) that provide Temperature and Rotation details.
The following describes the information you will find on this page:
...
1. Interface Menu: Navigation menu for the Vertex interface..
2. Command Buttons:
...
These are the primary control options.
3. Radar Details: Summary of radar details.
4. Uptimes: Uptimes of the system and firmware
...
.
Software: The cumulative hours that the software has been running.
System: The cumulative hours that the system has been running.
Running: The cumulative hours that the radar motor has been running.
Total: The total uptime since the device was built.
Clients: The IP addresses and number of currently connected clients
5. Time Sync: This panel will show which of the two time synchronisation protocols is being used by the system, and it’s status. The Time Sync status is updated as part of the system health message, every 5 seconds.
PTP: The status of the current PTP master.
NTP: The status of the NTP remote server.
6. Health Status: Overview of key health metrics including temperatures, rotation speed and data packet rate.
Min / Max Values (Red):The min & max allowed values for each metric.
Expected Value (Green): Expected value based on the configuration of the radar.
Actual Value (Blue): Instantaneous value.
6. Status Footer: Includes the firmware version number and a link to download the Navtech root certificate.
Selecting the Rotation tab will show more health metrics:
...
Command Buttons
| Status | ||||
|---|---|---|---|---|
|
Report: Display the Radar Configuration Report that details all of the key sensor settings, in a separate browser tab.
...
System
| Status | ||||
|---|---|---|---|---|
|
| Status | ||||
|---|---|---|---|---|
|
This page section covers details detailed settings related to the radar hardware and , firmware and network configuration. Click the System Information option to reveal the three sub-headings.
...
Hostname: The network hostname of the radar.
...
Trigger Details: This indicates how each azimuth sample is triggedtriggered:
Timed: This means that each sample is taken based on clock driven trigger. This option ensures a very consistent sample rate that is not tied to the mechanical rotation.
Encoder: This means that each sample is taken based on a fixed number of steps on the encoder. This options ensures each sample is taken at the same angle on every rotation.
Starting Staring Mode: Indicates if the radar is staring mode and is therefore not rotating. This mode is typically used for performance testing in the factory. We warn users that the system is in staring mode by displaying a yellow triangle icon and turning the fields from white to yellow. In normal operation the Starting Mode should be disabled.
...
| Status | ||||
|---|---|---|---|---|
|
| Status | ||||
|---|---|---|---|---|
|
| Status | ||||
|---|---|---|---|---|
|
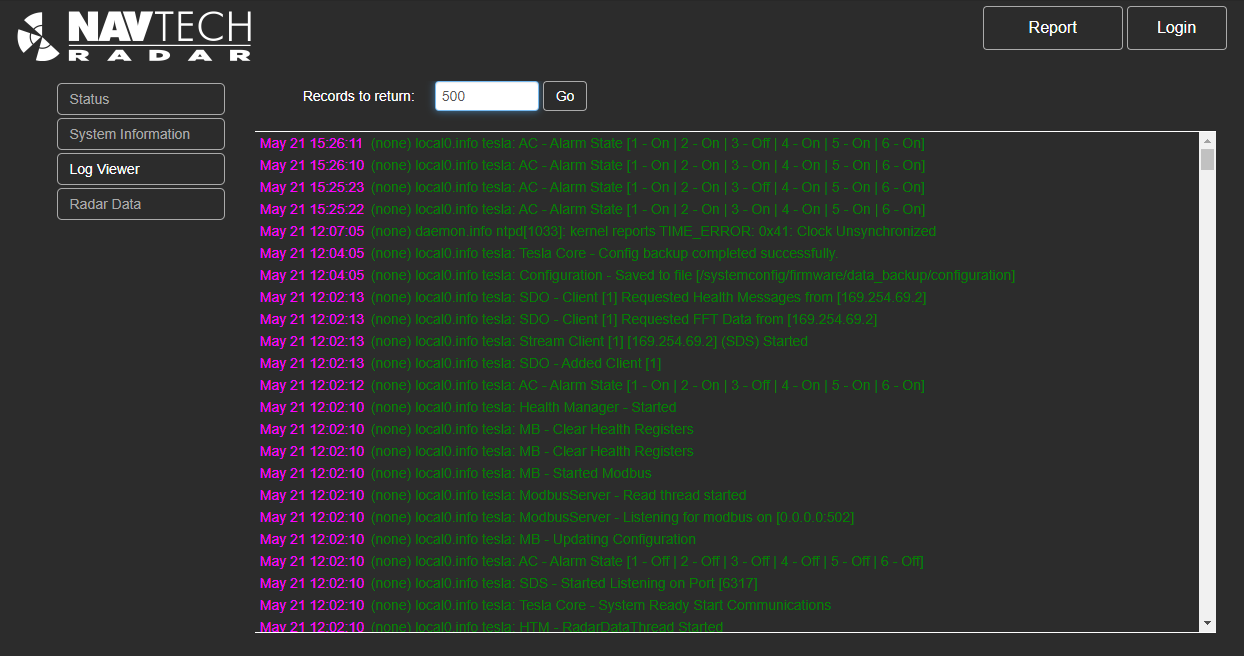
This page provides the ability to view the radar logs. It also allows authorised users to download the complete log file.
...
Authorised users will have the Download complete log option.
...
a full list of all sensor activities.
To view the current logs:
Enter the number of recent lines you wish to view and select Go.
The selected logs lines will be displayed in descending time / date order
...
:
...
| colour | Purple |
|---|---|
| title | AUTHorised |
...
Select the Download complete log button.
The file will be downloaded to the browser default download folder.
...
Authorised users will have the option to download these logs. Please refer to https://navtechradar.atlassian.net/wiki/spaces/PROD/pages/2451570689/User+-+Log+Viewer#Download-Logs for more information.
Radar Data
| Status | ||||
|---|---|---|---|---|
|
| Status | ||||
|---|---|---|---|---|
|
| Status | ||||
|---|---|---|---|---|
|
| Status | ||||
|---|---|---|---|---|
|
This page displays a snapshot of the live radar data. It also provides the capability for authorised users to add and remove sectors when using Sector Blanking.
...