...
Open a supported browser and enter the IP address of the radar.
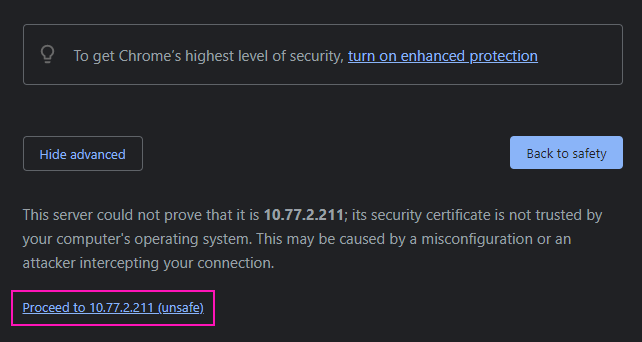
Dismiss the warning and continue. The process can vary between browsers, the example illustrated here is using Chrome.
Select the Advanced button:


Click on the displayed link:
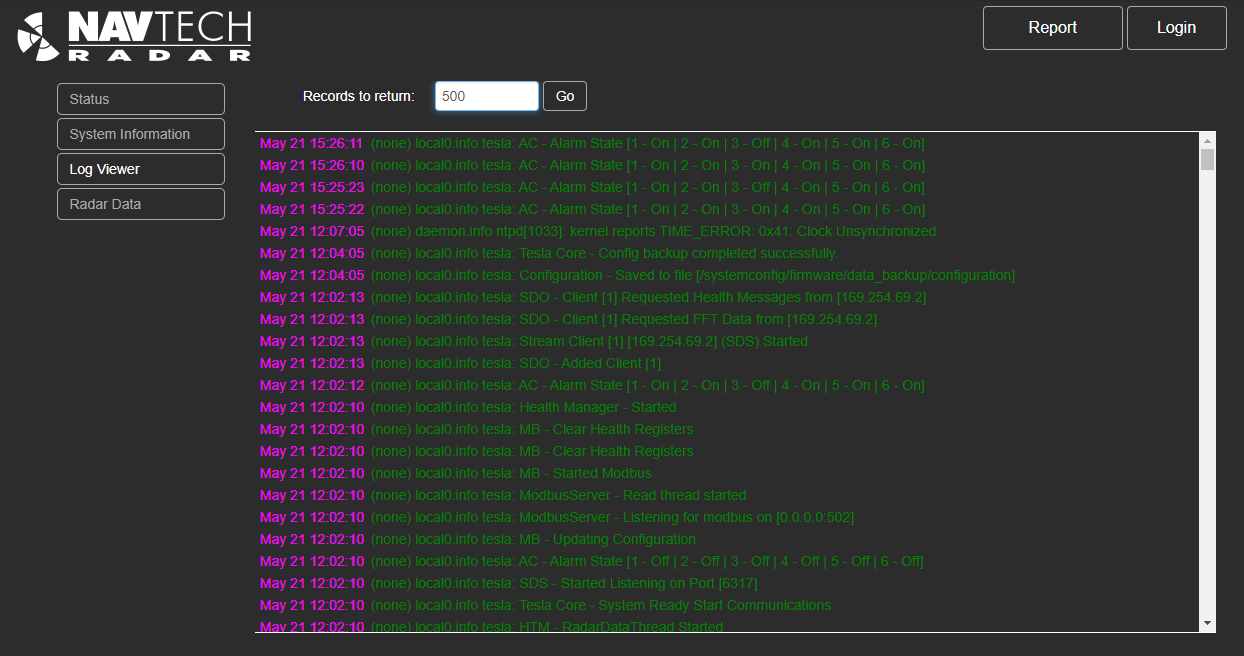
The radar’s default status page will now load
...
5. Time Sync: This panel will show which of the two time synchronisation protocols is being used by the system, and it’s status. The Time Sync status is updated as part of the system health message, every 5 seconds.
PTP: The status of the current PTP master.
NTP: The status of the NTP remote server.
...
Enter the number of recent lines you wish to view and select Go.
The selected logs lines will be displayed in descending time / date order:

Authorised users will have the option to download these logs. Please refer to https://navtechradar.atlassian.net/wiki/spaces/PROD/pages/2451570689/User+-+Log+Viewer#Download-Logs for more information.
...